


Getting your management accounts right is a game-changer. It’s the difference between guessing where your business is heading and knowing exactly what’s driving performance. This process takes raw financial data and turns it into clear, actionable insights by gathering the right numbers, making key adjustments (like accruals and prepayments), and then producing the core reports: your Profit & Loss, Balance Sheet, and Cash Flow summary.
Before you dive into building any reports, you need to get the foundations right. Think of it like building a house – you wouldn't dream of putting up walls without first laying a perfectly level concrete base. Skip this part, and you’re setting yourself up for major headaches later on.
Getting these initial steps spot-on ensures the reports you produce are a true reflection of your business's health. It all comes down to mapping your accounts correctly, picking the right metrics, and making sure your data is squeaky clean.
This workflow shows how these first pieces fit together.
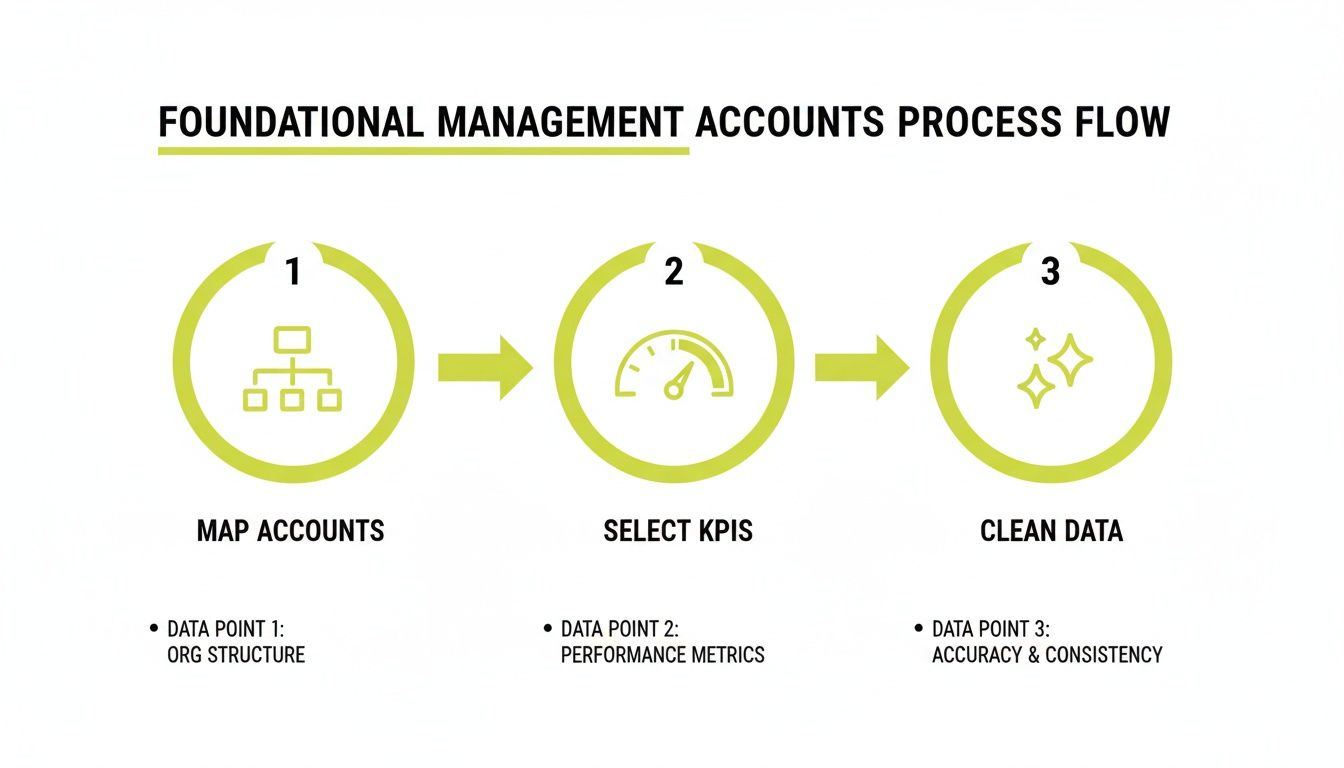
As you can see, a methodical approach is everything. You need to structure your accounts, decide what to measure, and then get the data in order. Only then can you build reports you can actually trust.
Your Chart of Accounts (CoA) is the DNA of your financial reporting. It’s far more than just a list of codes; it's a bespoke map of how your business actually operates and makes money. The generic CoA your accounting software gives you out of the box simply won't cut it for meaningful insights.
For instance, a marketing agency should break down its revenue codes. Instead of one big "Sales" pot, they might have ‘Retainer Fees’, ‘Project-Based Work’, and ‘Commission Income’. This small change immediately tells them which revenue streams are firing on all cylinders. The same logic applies to your cost codes – they need to mirror how you really spend money.
Next up, you need to decide what you’re actually going to measure. Your Key Performance Indicators (KPIs) have to be relevant to your specific business model. Just tracking total revenue is a rookie mistake; you need metrics that expose the true health and efficiency of your operations.
Getting your financial data aligned with these crucial metrics is job number one. It’s also a key part of staying compliant with the Companies Act 2006, which legally requires you to keep adequate accounting records.
This step is absolutely non-negotiable. Your management accounts are only as good as the data you feed them. If you put garbage in, you’ll get garbage out – and that leads to flawed reports and, ultimately, terrible business decisions.
Think of it as financial hygiene. Before you even think about creating a report, you must have the following ticked off:
A solid grasp of business intelligence and reporting is what turns all this raw data into the clear, actionable insights needed for management accounts that actually drive decisions.
Here's a quick rundown of the essential data streams you'll need to pull together.
Getting these elements right from the very start is paramount. If you're finding it all a bit much, it might be worth exploring professional bookkeeping services. They can provide the support you need to keep your records clean and accurate, month in, month out.
Think of your Profit and Loss (P&L) statement as the monthly story of your business's performance. It’s the bottom line: what you earned versus what it cost you to earn it. A well-crafted P&L isn't just a boring list of sales and expenses; it’s a powerful tool that lets you feel the true financial pulse of your operations.
But here’s the thing: just printing the standard report from your accounting software won't cut it. The real magic in preparing proper management accounts lies in the month-end adjustments. These are what turn your basic bookkeeping records into something you can actually use to make smart decisions.

To get an accurate P&L, you have to account for things that don't always show up in your day-to-day transactions. This is where accrual accounting comes in, matching income and expenses to the period they actually relate to, not just when the money moves.
Here are the key adjustments you'll be making:
Without these adjustments, your profit figures will be all over the place – misleadingly high one month and worryingly low the next. It completely masks what's really going on.
The whole point of these adjustments is to create a 'true and fair' view of your company's profitability for that specific period. It smooths out the financial bumps caused by the timing of payments, giving you a much clearer picture for decision-making.
A generic P&L from your software is a starting point, but it rarely tells the whole story. To make it truly useful, you need to structure it in a way that mirrors how your business actually works. That usually means breaking down your income and costs by department, project, or team.
Take a UK digital marketing agency, for instance. A simple P&L is okay, but one broken down by "cost centres" is far more powerful.
Suddenly, you can see that the Content Team is your most profitable department by margin (50%). That's valuable intel when you're deciding where to invest for future growth. Breaking down staff costs is also vital, and to do it right, you'll need to know how to calculate employer pension contributions as part of the total employment cost.
This kind of structure transforms your P&L from a document you file away into a strategic dashboard, showing you exactly what’s driving your business forward.
While the P&L tells you how your business performed over a period, the Balance Sheet offers something just as vital: a snapshot of your company's financial health at a single point in time. It’s the ultimate statement of what you own (assets), what you owe (liabilities), and what’s left for the owners (equity).
Think of it as a financial photograph of your company, taken on the last day of the month.
This report is fundamental because it reveals your stability. A business can look profitable on the P&L but be dangerously fragile if its balance sheet shows it can't cover its short-term debts. Getting to grips with this document is absolutely key to building a resilient, financially sound business.

One of the most powerful ways to use the balance sheet in your management accounts is to analyse the working capital cycle. This is the lifeblood of your day-to-day operations, showing how well you're managing cash flow and short-term liquidity. You calculate it by looking at your current assets and subtracting your current liabilities.
A healthy working capital position means you have enough liquid assets to cover your immediate debts. An unhealthy one is a huge red flag—it can signal a cash flow crisis is just around the corner, even if you’re technically making a profit.
Here’s what to focus on:
Let’s picture a UK tech startup. In January, their balance sheet shows £50,000 in debtors and £10,000 in the bank. Their creditors total £20,000. So far, so good.
By March, their P&L is showing soaring sales, which looks fantastic on paper.
But the March balance sheet tells a different story. Debtors have ballooned to £120,000, and the cash at bank has dwindled to just £2,000. At the same time, their creditors have shot up to £45,000. This business, while profitable, is on the brink of being unable to pay its staff or suppliers because all its cash is tied up in unpaid invoices. It's a classic working capital crunch.
Tracking the balance sheet month-on-month is not just a bookkeeping exercise; it’s an early warning system. It flags dangerous trends like soaring debtor days or plummeting cash reserves long before they become critical, giving you time to act.
This kind of analysis is the cornerstone of useful management accounts. Lenders know this; for UK businesses seeking finance, a grip on working capital is non-negotiable, and the British Business Bank guidance reinforces the need for a monthly balance sheet. This is especially critical when you consider UK firms grappled with median debtor days reaching 66 in 2023. You can see how significant assets are tracked in action; for example, the UK Statistics Authority's 2024/25 accounts detailed a rise in capital expenditure to £25.8m, driven by software and property investments. You can explore more about how public bodies report their financial position by reviewing the full report on their capital investments.
To get a reliable balance sheet, your underlying bookkeeping has to be perfect. Unlike the P&L, which effectively resets each year, the balance sheet is cumulative. An error made six months ago will still be lurking there, distorting your current financial picture.
This means every single bank account, credit card, loan account, and control account (like PAYE and VAT) must be fully reconciled. Any unreconciled items are basically errors waiting to throw your figures out.
The core principle is simple but absolute:
Assets = Liabilities + Equity
If your balance sheet doesn't balance, it means there's a mistake somewhere in your accounts. Modern cloud accounting software automates much of this, but it’s still crucial to manually review the key figures. Check that your fixed asset register is up-to-date with new purchases and that monthly depreciation has been posted correctly. Make sure your loan balances match the statements from your lender. This diligence ensures the snapshot your balance sheet provides is sharp and accurate, not blurry and misleading.
There's an old saying in finance that gets thrown around a lot, but it’s absolutely true: profit is an opinion, cash is a fact. While your P&L is great for showing profitability on paper, it’s the Cash Flow Statement that tells you whether you can actually survive and grow. For any SME, this report is the real acid test, tracking every pound that moves in and out of your business.
A profitable P&L can easily hide a looming cash crisis. The Cash Flow Statement cuts through the noise of accrual accounting, reconciling your net profit back to what’s actually happened in your bank account. It’s the ultimate reality check.

A historical cash flow summary is handy, but the real power comes from forecasting. Looking ahead is what allows you to dodge problems and jump on opportunities. For most UK SMEs, this means getting into the rhythm of two key forecasts.
Think of your 13-week forecast as your operational radar. It’s a detailed, week-by-week projection of cash coming in and going out, designed to manage your immediate liquidity. It forces you to get granular about the timing of every payment.
This is what helps you answer the really critical questions:
This short-term view is essential for day-to-day tactical decisions, helping you juggle supplier payments and keep the lights on.
Working alongside your short-term view, a rolling 12-month forecast is all about strategic planning. This is a higher-level look that helps you model different scenarios and make bigger decisions about the future.
You'll use this document to plan for major investments, figure out if you can afford to hire new staff, or map out your capacity for growth. It’s also a non-negotiable if you're looking for finance from a bank or investors, as it proves you're on top of your numbers. A key part of this starts with the right foundations; our guide on how to set up a business bank account will get you started on the right foot.
A core element of preparing UK management accounts involves creating both a 13-week outlook and a 12-month forecast. This discipline is vital, especially as recent statistics showed UK firms facing median debtor days of 66.
Banks frequently ask for up-to-date accounts and detailed cash flow forecasts when assessing loan applications, and having them ready can speed up approvals significantly. For a real-world example, the ICO's February 2025 management accounts detailed how forecasts were adjusted for £2.4m in cost reductions offset by £1.0m in pay rises, showing how forecasting directly shapes strategic decisions. You can see for yourself how public bodies apply forecasting in their financial reports.
Let's imagine a growing UK contractor business that’s just landed a big new project. Their P&L is looking fantastic. The catch? The project requires them to buy £30,000 of materials upfront, but the client's payment terms are 60 days.
Without a cash flow forecast, they might blindly agree, only to realise next month that they can't pay their own staff and suppliers.
By building a simple 13-week forecast, however, they spot the problem immediately. The £30,000 cash outflow in week 2 creates a nasty deficit by week 6. Armed with this insight, they can get proactive.
They could:
This one simple forecasting exercise transforms them from being reactive victims of cash flow into proactive managers of their financial destiny. It ensures they have the cash to deliver the project and keep the business growing.
The numbers in your Profit & Loss, Balance Sheet, and Cash Flow reports are just the raw materials. By themselves, they’re interesting, but their real value is unlocked when you turn them into business intelligence through sharp analysis and clear commentary.
Honestly, this is the final and most crucial step in preparing management accounts that actually drive your business forward. It's what transforms a collection of tables into a strategic tool for your leadership team.
Without this layer of interpretation, you're just presenting data. With it, you're providing insight, telling the story behind the numbers, and guiding your team toward better decisions. This is where your financial reporting becomes a true competitive advantage.
The first place to start building your commentary is with a solid variance analysis. This is a straightforward but incredibly powerful exercise where you compare your actual results against a benchmark to understand what went right, what went wrong, and—most importantly—why.
Your analysis should zero in on three key comparisons:
Don’t just state the differences; dig into the reasons behind them. A £10,000 overspend on marketing isn’t just a number; it’s a story. Was it a planned campaign that delivered an excellent return on investment, or was it an unexpected cost overrun on a particular channel that needs investigating?
Once you've done the analysis, the next job is to distill your findings into a concise, one-page executive summary. This is arguably the most valuable page in the entire management accounts pack because it’s written for busy people who need the key takeaways, fast. The goal here is to be clear, direct, and forward-looking.
A great summary always answers three core questions:
Your commentary should be the bridge between historical data and future strategy. It's not just about reporting what has already occurred; it's about using that information to inform the next set of decisions and steer the company in the right direction.
This process is what makes management accounts a living document, not just a historical record. For those looking to elevate this strategic input, bringing in high-level expertise can be a game-changer. The insights of a fractional finance director can be invaluable here, helping to translate financial data into robust commercial strategy.
And remember, effective management accounts aren't just about looking back. To really enrich your commentary, you should explore advanced finance FP&A data analysis tools for forecasting and scenario planning.
When you’re first getting your head around management accounts, it’s natural to have a few questions. Let's tackle some of the most common queries we hear from UK business owners just like you, with some straight-talking answers to get you started on the right foot.
For almost any UK SME, contractor, or startup, the answer is simple: monthly.
A monthly reporting cycle is the gold standard for a reason. It gives you timely, relevant information about what’s really going on in your business, allowing you to react quickly to opportunities and nip problems in the bud before they escalate. Think of it as your business’s regular health check.
This rhythm helps you measure performance against your budget, keep a tight grip on cash flow, and make properly informed decisions. While some very stable businesses might get away with quarterly reports, in today's fast-moving world, monthly insights offer a massive competitive advantage.
Don't forget, if you're seeking funding, lenders and investors will almost always want to see up-to-date monthly management accounts. It's non-negotiable proof that you have solid financial control.
This is a really common point of confusion, but the two serve completely different masters. The easiest way to think about it is your car’s live dashboard versus its annual MOT certificate. One helps you drive day-to-day, the other is a legal check-up.
Management Accounts are:
Statutory Accounts are:
In a nutshell, management accounts are for actively managing the business, while statutory accounts are for official reporting.
Technically, yes. Modern cloud accounting software makes it easy to generate the basic reports like a P&L and Balance Sheet with a few clicks. But—and it's a big but—producing high-quality management accounts that you can actually rely on involves more than just printing off what the software spits out.
The real value, the kind that drives better decisions, comes from the bits that require a proper understanding of accounting. We're talking about crucial month-end adjustments like accruals, prepayments, and depreciation. Without these, your reports could be painting a dangerously misleading picture of your performance.
Beyond the adjustments, the magic is in the analysis—spotting trends, understanding why you were over or under budget, and writing commentary that turns raw numbers into a clear story. Software gives you the data; a human brain provides the insight.
A great middle-ground for many SMEs is to use their software for the day-to-day bookkeeping and then bring in an accountant to handle the tricky month-end adjustments and help build out the analysis. To get a feel for the tools that can help, check out our guide to the best cloud accounting software for startups. This hybrid approach gives you a fantastic balance of hands-on control and expert oversight.
At GenTax Accountants, we specialise in turning your financial data into clear, actionable insights. If you're ready to move beyond basic reports and start using management accounts to drive real growth, get in touch with our team today. Find out more at https://www.gentax.uk.
