


Reading financial statements is all about getting to grips with three core documents: the income statement, the balance sheet, and the cash flow statement. By analysing these, you can truly understand your company's performance, what it owns and owes, and how it’s managing its cash.
Together, these reports provide a complete picture of your business's financial health, allowing you to move beyond gut feelings and make smart decisions based on solid data.

Before we get into the nitty-gritty, it’s vital to appreciate why this skill is so essential for any business owner, investor, or manager. Think of financial statements as an x-ray of your company. They reveal the underlying structure, performance, and potential fractures that just aren't visible from the surface.
Learning how to read these documents transforms abstract figures into a compelling story about your company’s journey. It means you can answer those critical questions with confidence:
Without this insight, you’re essentially flying blind, making strategic calls based on half the story.
To get a complete picture of a company's financial health, you need to look at three interconnected reports. Each one offers a unique perspective, and it's only by analysing them together that the full view emerges.
Let's quickly break them down.
Each statement tells a different part of the story, and they all work together to give you that crucial 360-degree view.
A classic mistake is to focus only on the income statement. A company can look profitable on paper but fail because of poor cash management—a critical insight that only the cash flow statement can give you.
Here in the UK, understanding these documents is both a legal requirement and a practical necessity. The Companies Act 2006 requires all companies to prepare annual financial statements that give a "true and fair view" of their financial position.
These aren't just tick-box exercises. For instance, in 2023, data revealed that nearly 60% of FTSE 350 companies had a current ratio between 1.2 and 2.5, a key metric from the balance sheet that signals healthy short-term financial stability to investors and lenders.
Of course, expert guidance can make this whole process far more manageable. For growing businesses that need high-level financial oversight without the cost of a full-time executive, a fractional finance director can be invaluable for translating these complex reports into actionable strategy.
If you're keen to build your own skills, a great next step is to learn how to interpret financial statements effectively. In the sections that follow, we'll walk you through each of these reports, step by step.

While an income statement gives you the story of a company’s performance over a period, the balance sheet is a powerful snapshot. Think of it as a detailed photograph of a company's financial health on one specific day, capturing exactly what it owns and what it owes.
Everything on a balance sheet is built around one simple, unbreakable rule: the accounting equation. Get this, and you've unlocked the core concept.
Assets = Liabilities + Equity
In plain English, this just means that everything the business owns (Assets) has been paid for in one of two ways: either by borrowing money (Liabilities) or with money from its owners (Equity). The two sides of this equation must always balance out. It's the fundamental logic that holds a company’s financial structure together.
Assets are simply the economic resources a company controls that are expected to provide some future benefit. To make sense of them, they’re split into two key groups based on how quickly they could be turned into cash.
The distinction here is vital. A company could own a multi-million-pound factory (a non-current asset) but still face a serious cash crunch if it doesn’t have enough current assets to cover its immediate bills.
Liabilities are the company's debts and financial obligations to others. Just like assets, they’re categorised by their due date, which is incredibly helpful for figuring out a company's short-term and long-term financial risk.
The breakdown is nice and straightforward:
A big pile of short-term liabilities compared to current assets can be a major red flag, hinting at potential liquidity problems down the road. On the other hand, a manageable level of long-term debt that’s been used to buy growth-driving assets can be a sign of a smart, forward-thinking strategy.
The balance sheet doesn't just list figures; it tells a story about a company's strategic choices. A heavy investment in non-current assets could signal a big bet on long-term growth, whereas a large cash pile might suggest a more cautious approach or that the business is gearing up for a major acquisition.
Equity, which you might also hear called shareholder's equity or net worth, is what’s left after you subtract all the liabilities from all the assets. It’s the owners' stake in the company. Put another way, if the business sold everything it owned and paid off every single debt, the equity is what would be returned to the owners.
Equity generally consists of two key parts:
Retained earnings are a brilliant indicator of a company's historical profitability. If you see this number consistently growing, it’s a great sign. It means the business has a track record of making a profit and has been ploughing that money back in to fuel more growth. This is also how the income statement and balance sheet are directly linked.
Understanding these statements is not just for compliance; it's a core part of strategic planning. For many UK businesses, getting professional help with their company accounts preparation ensures everything is spot on and helps uncover insights you might otherwise miss. By properly decoding the balance sheet, you get a crystal-clear view of a company's financial stability, a critical skill when learning how to read financial statements.

If the balance sheet is a single snapshot in time, the income statement is the full-length film. It tells the story of your business's financial performance over a specific period—whether that’s a month, a quarter, or a full year.
Sometimes called the Profit and Loss (P&L) statement, it gets right to the heart of the most important question in business: did we actually make any money?
The statement is a logical journey, starting with the total sales at the very top (the Revenue) and systematically subtracting all the costs to arrive at the famous bottom line (the Net Income). Grasping this flow is absolutely fundamental to making sense of your company's finances.
To bring this to life, let’s follow the money for a fictional UK online clothing shop, "Manchester Threads," and see how they performed over one financial year.
Every P&L statement kicks off with Revenue, which you might also see called 'sales' or 'turnover'. It’s simply the total amount of money the business generated from its sales before a single cost is taken out. For Manchester Threads, this is the grand total from every piece of clothing they sold that year.
Let's say Manchester Threads brought in £1,000,000 in revenue.
The first thing we deduct from this is the Cost of Goods Sold (COGS). These are the direct costs tied to creating the products you sold. For our clothing retailer, this would include the cost of the fabric, the manufacturing process, and getting the finished garments to their warehouse.
Assuming their COGS was £400,000, we can work out our first crucial profit figure.
Gross Profit = Revenue - COGS
That £600,000 is the Gross Profit. It tells you how much money the business made purely from selling its products, stripping out the direct production costs. It's a fantastic first look at how efficient your production is and whether your pricing strategy is on the right track.
Gross profit is a great start, but it's far from the whole picture. Businesses have plenty of other costs just to keep the lights on and the doors open. We call these Operating Expenses (OpEx).
These are all the essential costs not directly linked to making one specific product. For Manchester Threads, this bucket would include things like:
Let's imagine their total OpEx for the year came to £350,000. Now we subtract this from the gross profit to find the Operating Income.
Operating Income = Gross Profit - Operating Expenses
Operating Income is a really clean measure of profitability. It shows how much money the core business operations are generating before financial items like loan interest or taxes start to cloud the view.
The income statement is often the first port of call for investors, and for good reason. A 2023 survey by ICAEW found that 85% of analysts focus on the income and cash flow statements for immediate insights into a company's profitability and financial health. You can find more insights in the Bank of England's financial stability report.
We're on the home stretch now. After calculating operating income, the final step is to account for any non-operating items—costs and revenues that aren't part of the main day-to-day business.
Deducting these gives us the one number everyone knows.
Net Income = Operating Income - Interest - Taxes
This £180,000 is the Net Income, famously known as the "bottom line." It’s the final profit left over after every single cost has been accounted for. This is the cash that can be either reinvested into growing the business or paid out to the owners as dividends. For more advanced strategies on this, our guide on management accounts and improving business performance is a great next step.
The raw figures on the P&L are important, but turning them into ratios gives you powerful context and allows for better comparisons. While there are many ratios you can use, the profit margins are arguably the most revealing.
Here’s a quick look at two of the most important ones derived from the income statement.
| Key Profitability Ratios from the Income Statement |
| :--- | :--- | :--- |
| Ratio Name | Formula | What It Tells You |
| Gross Profit Margin | (Gross Profit / Revenue) x 100 | This shows the profitability of each sale before you factor in overheads. A high margin suggests you have strong pricing power or very efficient production. |
| Net Profit Margin | (Net Income / Revenue) x 100 | This is the ultimate measure of profitability, showing what percentage of revenue is left after every single expense has been paid. |
Calculating these for Manchester Threads gives us some real insight:
So, for every pound Manchester Threads makes in sales, they keep 60p after paying for the goods themselves, and 18p in pure profit at the end of the day.
Tracking these margins over time is far more valuable than just looking at the absolute profit figure. A rising margin signals improving health, while a falling one can be an early warning sign that something needs your attention.
While the income statement tells you if you're profitable, the cash flow statement shows if you'll survive. Many accountants, myself included, consider it the most honest of the big three reports. Why? Because it follows the actual cash. No estimates, no depreciation funny business—just the hard facts of money moving in and out of your business.
It answers one simple but critical question: where did our cash come from, and where did it all go? This is vital because a company can look brilliant on the P&L statement, reporting healthy profits, yet still go under because it ran out of cash. This statement is your ultimate reality check.
To make sense of it all, the statement is neatly broken down into three key activities.
This is the lifeblood of your business. The operating activities section shows you the cash generated from your core, day-to-day operations. You can think of it as the cash-based version of your net income.
It kicks off with the net income figure from your P&L and then makes a few adjustments for any non-cash items. For example, it adds back depreciation (which is an expense on paper but not a physical cash outflow) and then factors in changes in working capital, like cash tied up in unsold stock or money customers still owe you.
A consistently positive cash flow from operations is a fantastic sign. It proves your core business model is self-sustaining and generating enough cash to pay its own way, without having to borrow or hunt for new investors.
Next up, let's see how the business is using its cash to invest in the future. This part of the statement tracks the cash spent on, or received from, selling long-term assets.
Here’s what you’ll typically find:
Now, a healthy, growing company will often show a negative cash flow from investing. Don't panic—this isn't a bad thing. It usually means the business is ploughing money back into assets that will fuel future growth. It's spending cash today to make more cash tomorrow.
The final piece of the puzzle shows the flow of cash between the company, its owners, and its lenders. It tells the story of how a business is raising capital and paying it back.
This section covers cash movements related to:
By looking at this, you can understand how the company is funding itself. Is it leaning heavily on new debt, or is it funded by its owners? Is it in a position to reward its investors with dividends?
The Profit vs. Cash Trap
It’s a classic mistake. A business sells £100,000 worth of goods on credit and books it as revenue, showing a lovely profit. But if the customer takes 90 days to pay, there's no cash from that sale to pay suppliers or staff. This is exactly how profitable companies go bust. The cash flow statement lays this risk bare.
While the three sections are insightful on their own, savvy investors and business owners often focus on a metric derived from the statement: Free Cash Flow (FCF). In simple terms, FCF is the cash a company generates after it's paid for all the capital expenditures needed to maintain or expand its asset base.
The basic formula is straightforward:
Free Cash Flow = Cash Flow from Operations - Capital Expenditures
So, why does this matter so much? FCF is the surplus cash the company can genuinely use as it pleases. It's the money left over to:
A business with strong and growing FCF is in a position of power. It has the financial flexibility to jump on opportunities and ride out economic storms, making it a highly attractive prospect for investors and a much more secure venture for its owners.
For startups and small businesses, managing this flow is everything. Keeping a close eye on these figures is far easier with the right tech. If you're looking at your options, our guide to the best cloud accounting software for startups can point you towards tools that give you real-time visibility over your cash flow—a must-have for making smart decisions on the fly.
Financial statements aren't standalone documents; they're three parts of the same story, intricately woven together. A single transaction sends ripples across all three reports. Grasping this dynamic relationship is the key to reading financial statements with real confidence.
To see this in action, let's trace a common business decision: a company buys a new delivery van for £30,000, paying for it with a business loan. This one event will touch the balance sheet, the income statement, and the cash flow statement.
The moment the van is purchased, the balance sheet changes. It has to reflect the new reality of what the company owns and owes, while keeping the fundamental accounting equation, Assets = Liabilities + Equity, perfectly in balance.
Here’s how it works:
The equation stays perfectly balanced. Assets went up by £30,000, and so did liabilities. At this exact moment, no profit has been made or lost; the company simply swapped one form of value (debt) for another (an asset).
Next, we turn to the cash flow statement to follow the money. Even though the company didn't use its own cash reserves, the loan proceeds are still a cash event. The transaction is broken down into two parts, showing how the cash was raised and then spent.
The purchase of the van is a classic Capital Expenditure (CapEx)—a major investment in an asset that will provide value for years. This is recorded as a cash outflow under Investing Activities.
At the same time, the new £30,000 loan is documented as a cash inflow under Financing Activities. These two entries tell the story behind the change in the company's assets and liabilities with total transparency.
The income statement isn't hit immediately, but the effect is significant and ongoing. The van is a long-term asset, so its cost isn't expensed all at once. Instead, it's spread over its useful life through a process called depreciation.
Let's say the van has a useful life of five years. The company will record a depreciation expense of £6,000 (£30,000 / 5 years) on its income statement each year. This is a non-cash expense, but it reduces the company's operating income and, ultimately, its net income (the "bottom line").
This single purchase creates a clear chain reaction. This infographic shows how events flow logically from one statement to the next.
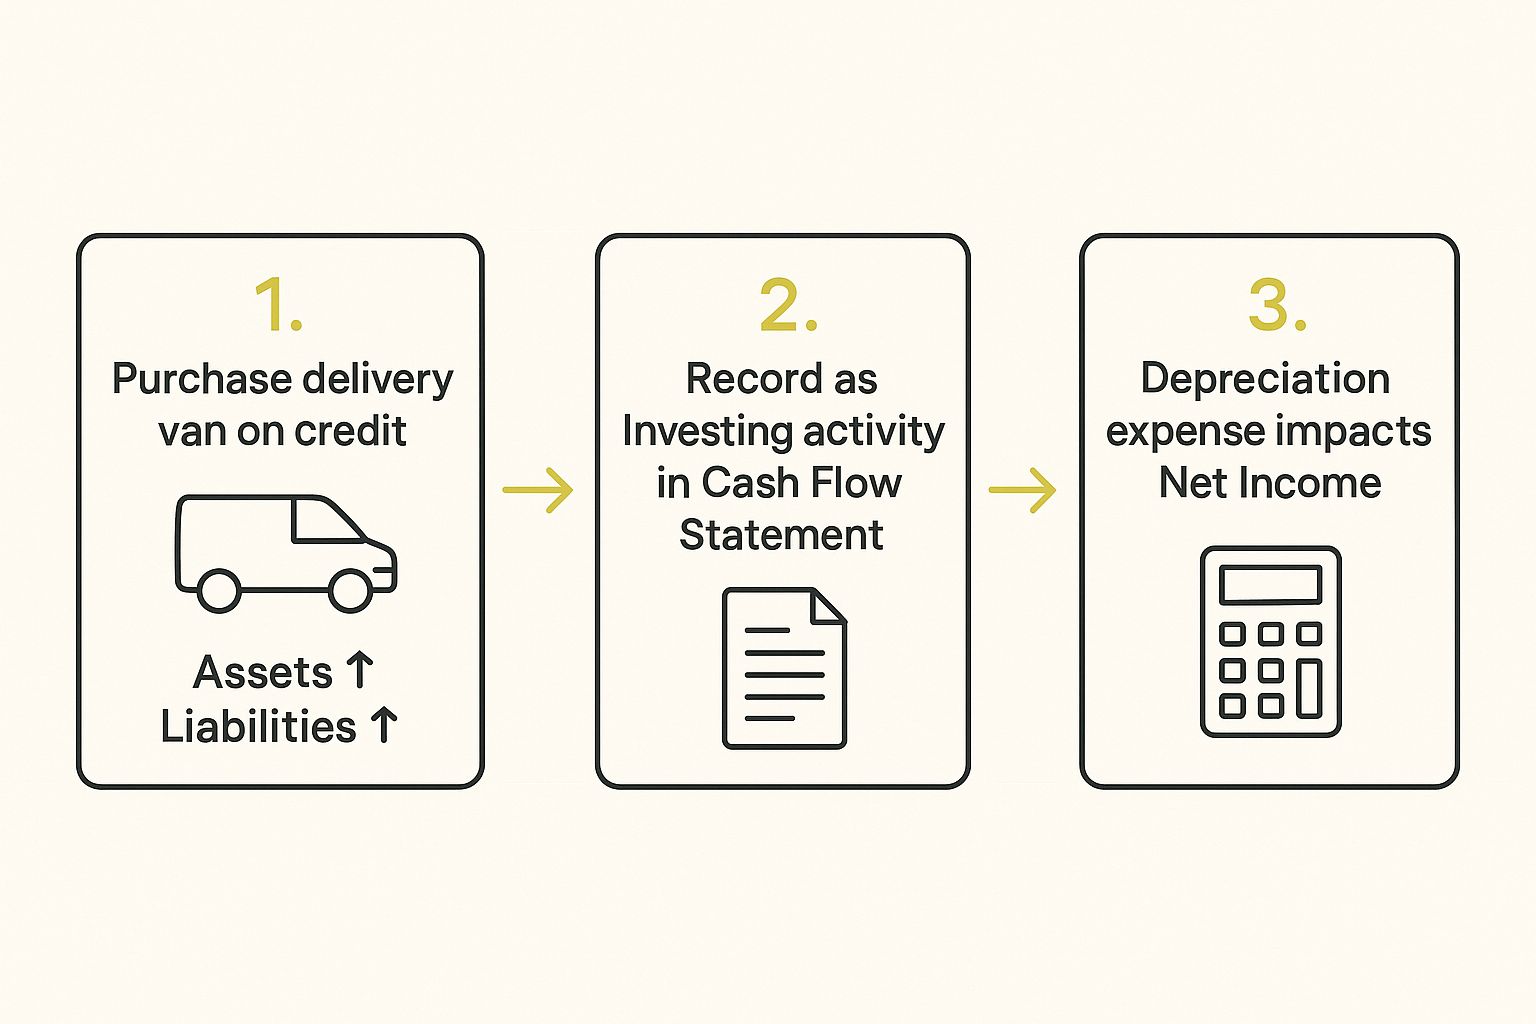
This visual makes it clear: a balance sheet event immediately triggers an entry on the cash flow statement, which in turn creates future consequences for the income statement.
The Golden Thread: Net Income
The most direct link between the statements is Net Income. It’s calculated on the income statement, but it doesn't just sit there. Net Income is the starting point for the cash flow from operations section. It also flows directly into the balance sheet as an increase in Retained Earnings (part of equity), connecting profitability right back to the company's net worth.
Understanding these connections is what gives you a holistic view of the business. It’s also why meticulous bookkeeping services are so important. Accurate recording from the start ensures that every transaction is correctly categorised, allowing the three statements to tell a true and interconnected story.
When you see how they all interact, you're no longer just reading numbers—you're analysing the health of a living, breathing business.
Even after you get your head around the main reports, it's totally normal to have a few questions buzzing around. Getting comfortable with financial statements is a process, not a one-off event. Let's tackle some of the most common queries I hear all the time.
It's so easy to mix these two up, but understanding the distinction is absolutely critical.
Revenue is the big number at the top of the income statement. Think of it as the total cash register takings – it’s all the money a company brings in from selling its goods or services before a single expense has been taken out. It shows you the sheer scale of the business.
Profit, often called net income, is the famous 'bottom line'. This is what’s left over after every conceivable cost—from raw materials and staff wages to pesky interest payments and taxes—has been deducted from the revenue. A company can have eye-watering revenues but be left with virtually no profit if its costs are out of control. That’s why you have to look at both.
Good question. For any publicly traded UK company, your first port of call should be the 'Investor Relations' section of their official website. They're legally required to publish their reports for everyone to see.
Beyond that, every single company registered in the UK has to file its accounts with Companies House, which keeps a massive public database. You can also find these documents easily on financial news sites or even through your own brokerage platform.
The notes tucked away at the end of a financial report are essential reading. They provide crucial context on accounting policies, debt schedules, and potential risks like ongoing lawsuits. Skipping the notes means you're only getting half the story behind the numbers.
This is a classic concept that trips up a lot of people. The profit figure on an income statement isn't always 'real' money. It often includes non-cash expenses, like depreciation, which is just an accounting adjustment. A company can look profitable on paper but have an empty bank account, especially if its customers are taking forever to pay their invoices.
Cash flow, on the other hand, is the real deal. It tracks actual money moving in and out of the business. It’s a raw, honest look at whether a company can pay its bills, invest in new projects, and manage its debt right now. As the old saying goes, "profit is an opinion, but cash is a fact." This makes cash flow the ultimate health check for a business's short-term survival. As data gets more complex, it's also worth looking into how you can leverage AI for financial analysis to get faster, deeper insights.
At GenTax Accountants, we turn these complex numbers into clear, actionable insights for your business. If you want to move beyond just reading your financial statements and start using them to drive real growth, get in touch today. https://www.gentax.uk
